- File manager for Mac
- Task Manager for Mac
- How to Open Task Manager on Your MacBook
How to Open Task Manager on Your MacBook
Many users who have switched from Windows computers to Mac often wonder how to access Task Manager on Mac. The equivalent of Task Manager in Mac OS is called the Activity Monitor. It lets you control system settings, view information about Mac apps or processes, and even manage apps easily. Let’s find out how to open and use Activity Monitor.
Users situation
I have bought a new MacBook but have a confusion about how to open the task manager in mac. I am new to this so please help!— Apple Support Community
How to Open the Task Manager on Your Mac
To open the Task Manager on Windows, all you need is just right-click on the taskbar. When it comes to how to start Task Manager on Mac, the process is different. Below you will find several variants:
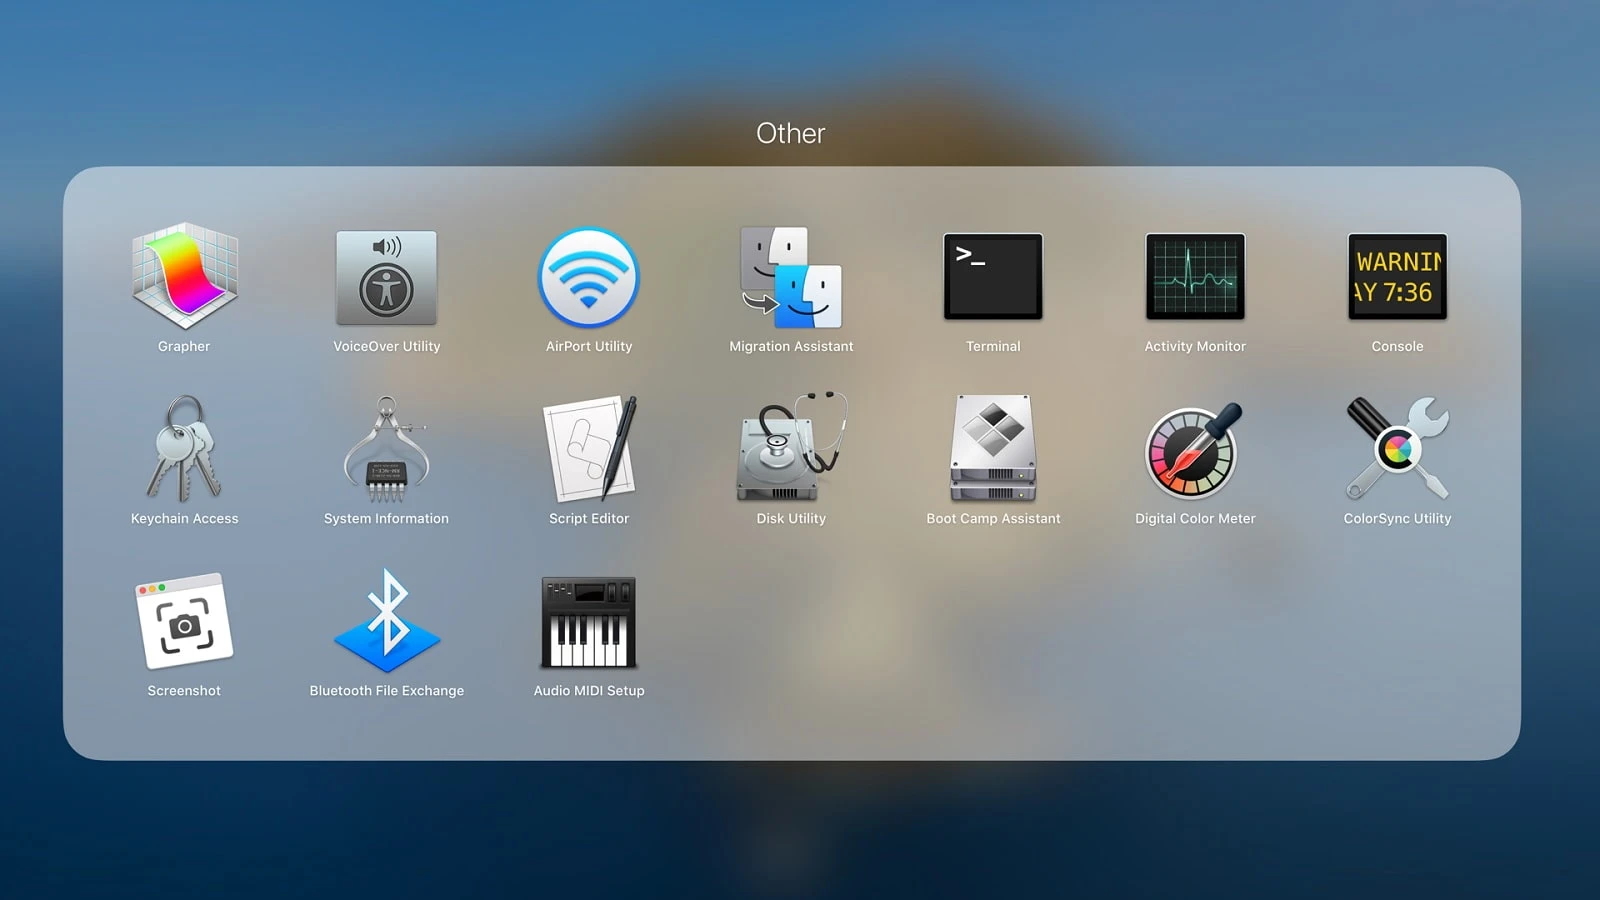
- Go to the Launchpad and enter “Activity Monitor” in the search box. Click on the “Activity Monitor” icon.
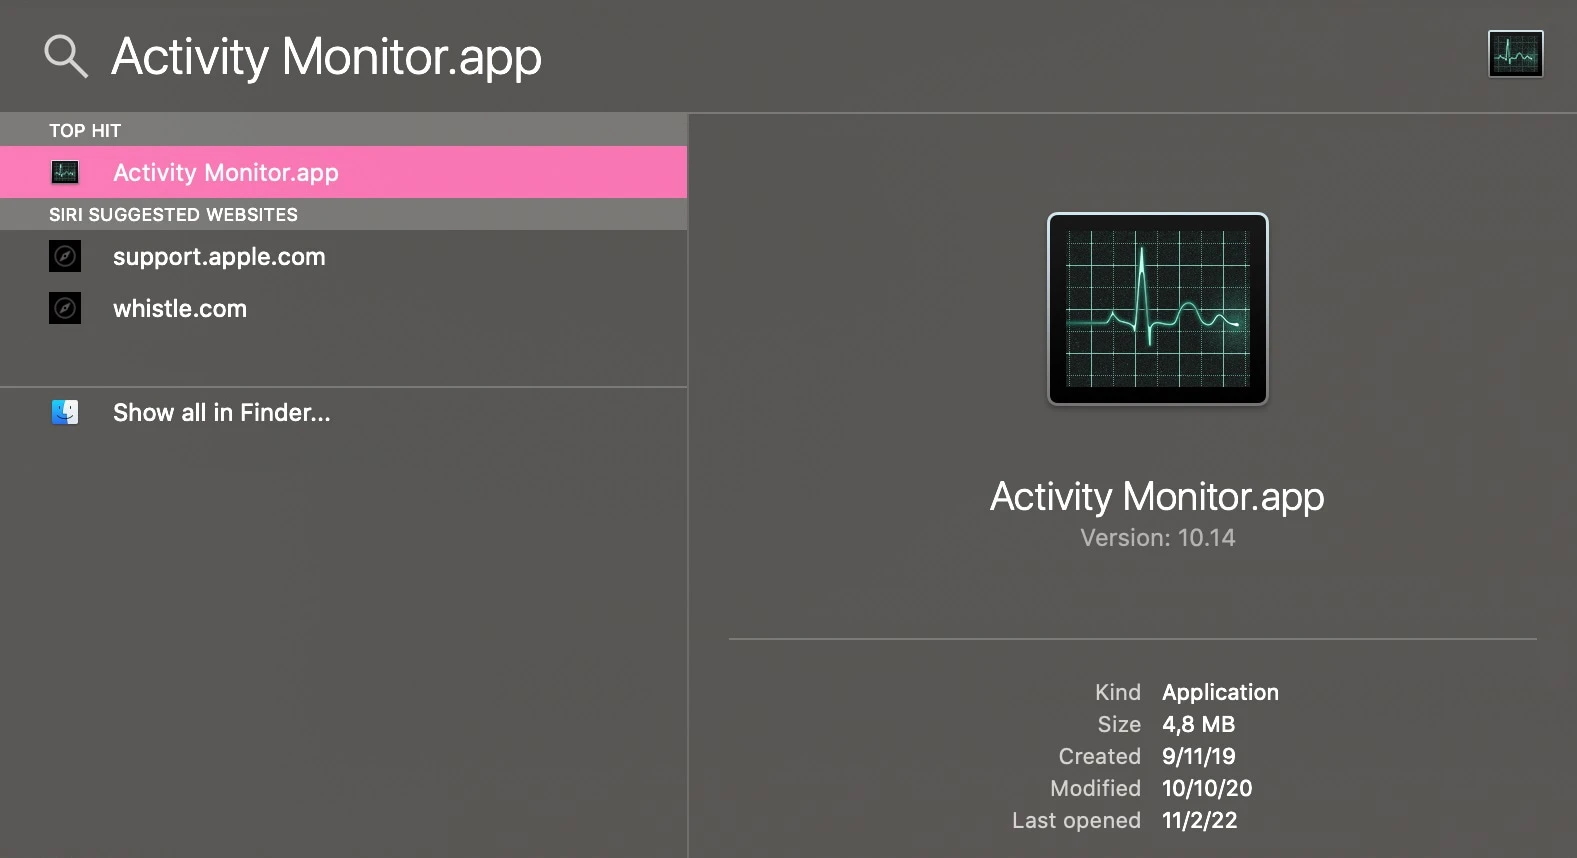
2. Use the Spotlight search. Just press the Command + Space key combination, type “Activity Monitor” in a search engine and press “Enter” to open the application. Instead of using a keyboard shortcut, you can also click the magnifying glass in the upper right corner of the screen to display the search engine.
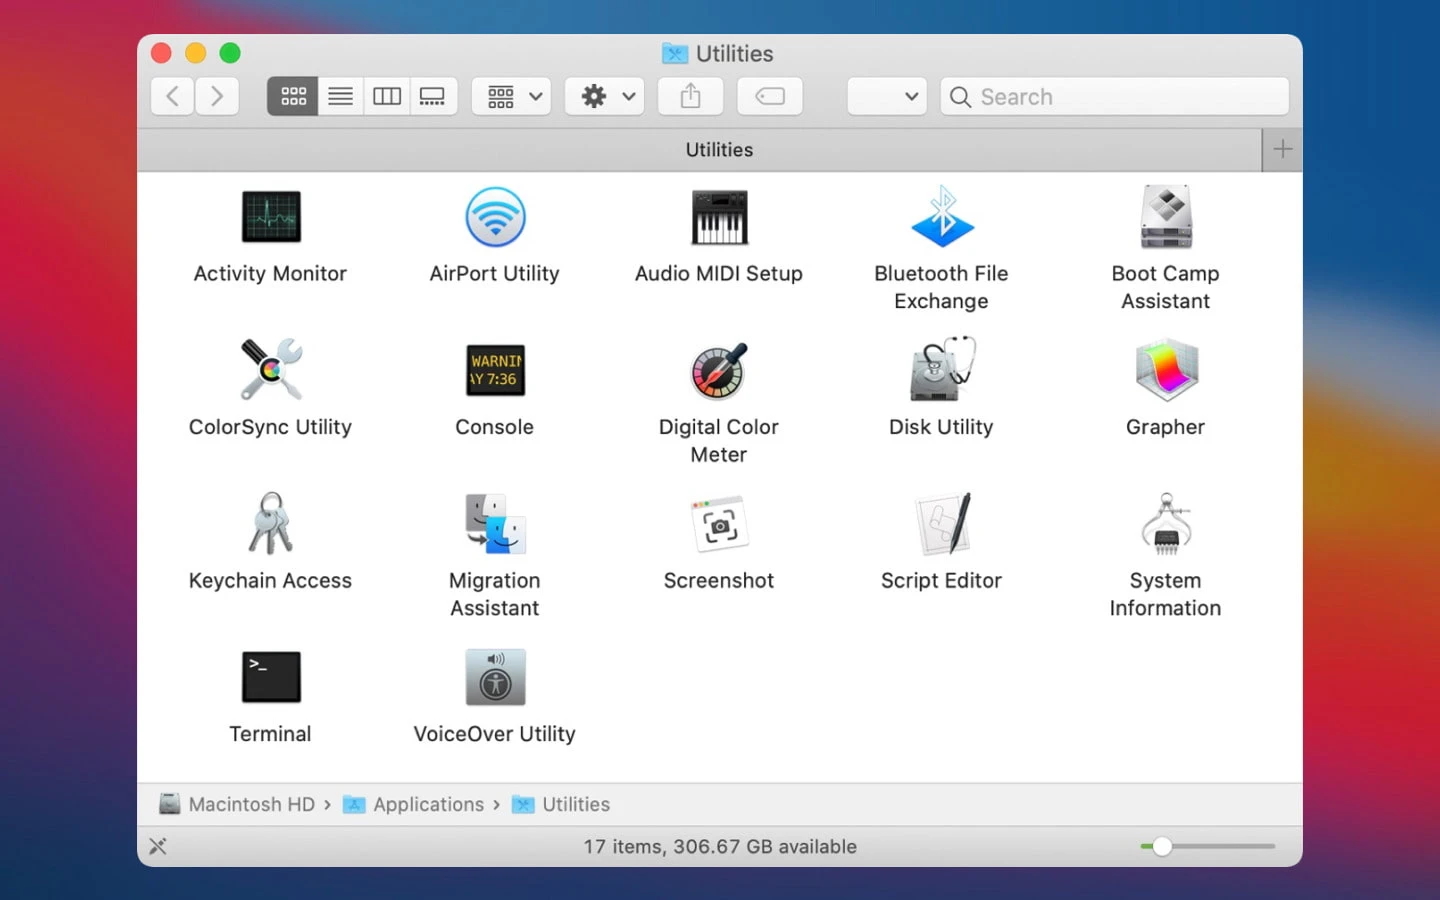
3. Navigate “Applications” and select the “Utilities” folder. Here find the “Activity Monitor” and double-click it.
Like many other applications installed on Mac, there are several ways to open Activity Monitor and it is all up to you: to choose the only one (the most convenient to you at any time) or use several of them according to your wishes.
Alternative Way to Use Task Manager MacBook
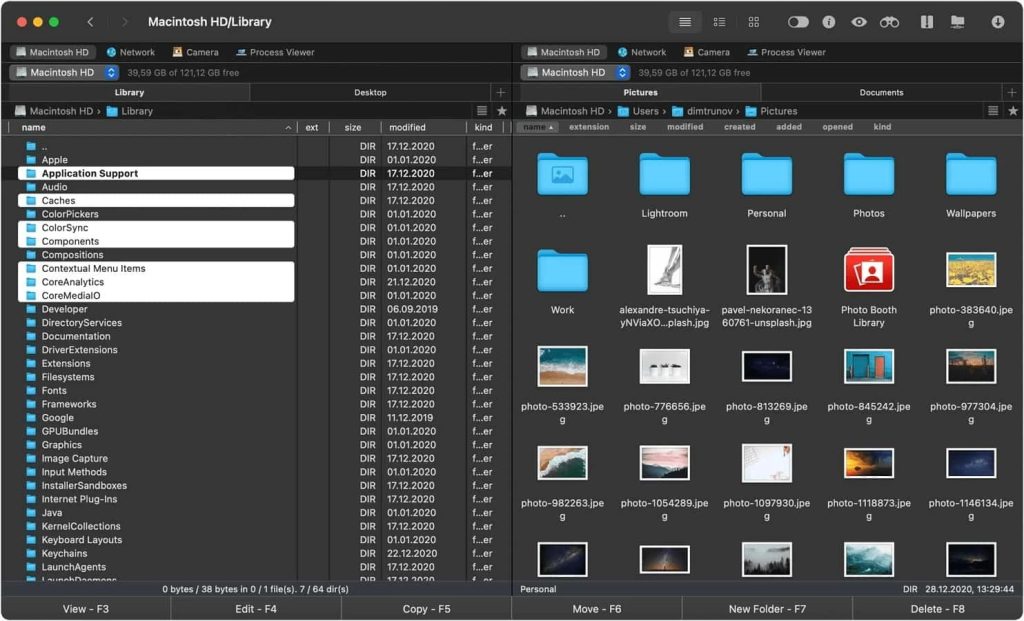
Activity Monitor is not the exact copy of the Windows analog and it lacks some features. That is why if you want to monitor the running processes a little more closely and get real-time updates on your Mac’s performance we can recommend you an excellent Mac Task Manager alternative – Commander One.
The app allows viewing and managing all the running processes on your Mac computer and if it is required to kill the process simply by pressing the Del button. Among the advantages of this app is the alphabetic order of all running processes with detailed information about them (the process name, PID, used memory, the date and the time of launch, etc.), the ability to kill even the system processes.
Besides that, Commander One is a powerful file manager that helps you to have well-organized documentation on your Mac with a huge variety of handy features (Terminal emulator, cloud storage integration, mounting and managing iOS, Android, and other devices supporting MPT protocol, root access, archiver, etc.).
Terminating Stubborn Programs with "Force Quit"
If you have used computers running Windows, then you know that the Ctrl+Alt+Delete is used for terminating unresponsive programs. There is a similar keyboard shortcut on the Mac as well.
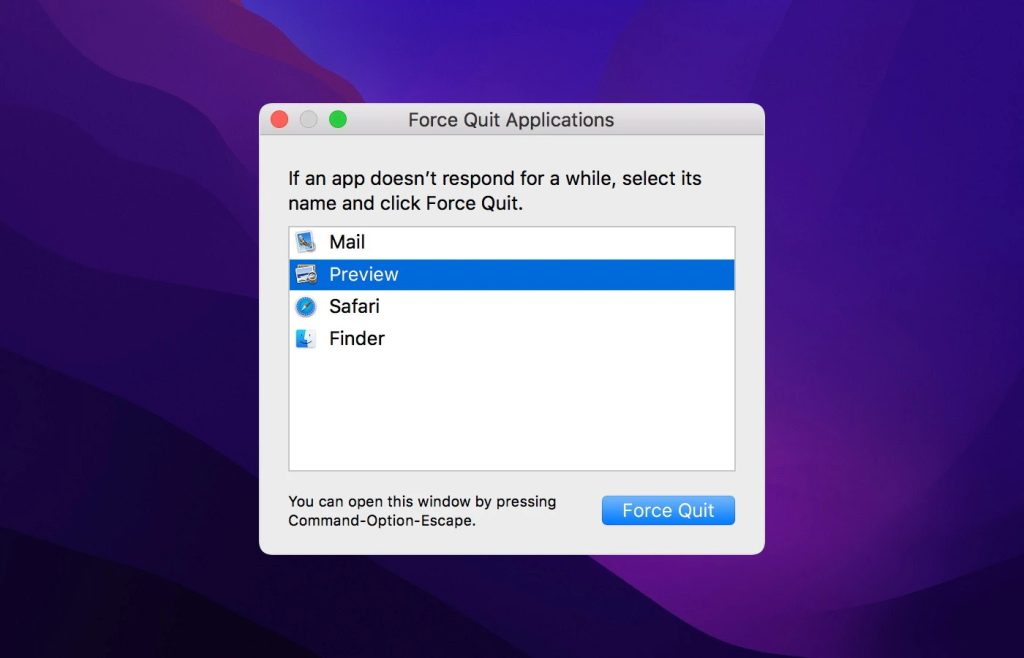
1. When a program stops responding, launch the “Force Quit Applications” dialog box by pressing Command + Option + Esc.
2. Once done, you’ll see a list of currently running applications.
3. Choose the unresponsive app from the list and click the “Force Quit” button.
4. A pop-up window will appear asking if you are sure. After confirmation, the app will be closed.
How to See Your System Status in the Dock with the Activity Monitor
Activity Monitor lets you view detailed information about the processes running on your Mac and how they affect CPU, memory, energy, disk, and network. What’s more, you can monitor the status of your system right in the Dock.
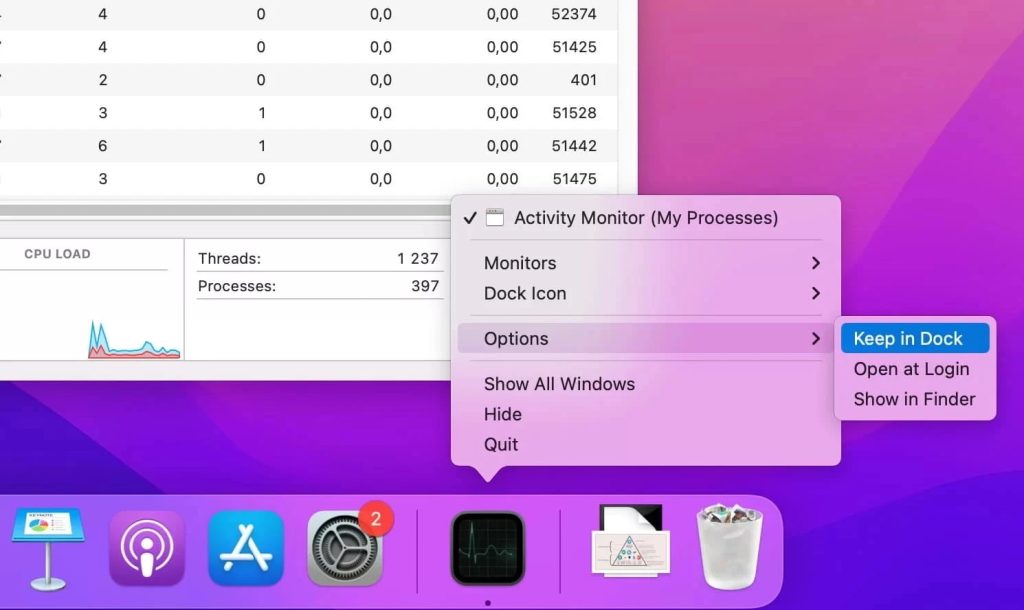
- Open the Activity Monitor.
2. Go to the Dock and right-click on the “Activity Monitor” icon.
3. In the pop-menu, hover over the “Dock icon”.
4. Choose one of the options and the Activity Monitor icon will change to the real-time update.
Mac Activity Monitor and CPU Load
The Activity Monitor is divided into several categories: CPU, Memory, Energy, Disk, Network, and Cache. They are the main indicators of system monitoring and also provide valuable information for troubleshooting. Each pane shows real-time statistics and resource usage graphs.
CPU Pane
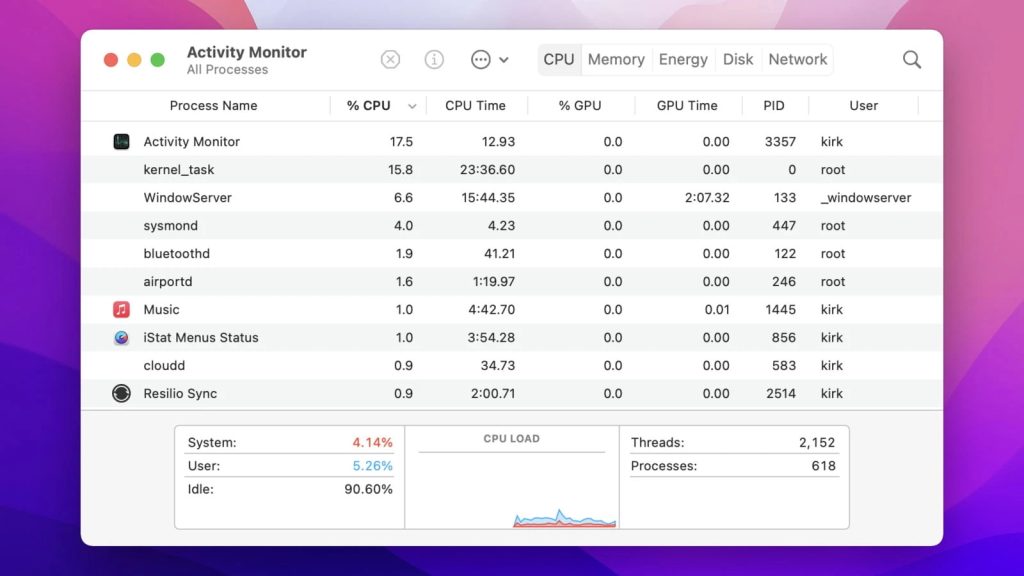
By default, Activity Monitor opens in the CPU tab that shows how each process uses the CPU on your computer. These statistics will help you determine which processes are affecting your Mac’s performance, battery life, temperature, and fan activity. At the bottom, you will find the following information:
- System. Percentage of the total CPU time the process is using (% CPU).
- User. The percentage of current CPU usage. This usage applies to applications that the user have opened.
- Idle. The percentage of time that the CPU is idle, not performing any tasks.
- CPU Load. CPU usage over time.
- Threads. The total number of threads used by all processes.
- Processes. The total number of processes.
Please note that when you open the Activity Monitor, the CPU usage for the kernel_task process is quite high. Also, the fan may work harder than usual. In simple terms, kernel_task regulates the load on the central processor, preventing the system from overheating.
Memory Pane
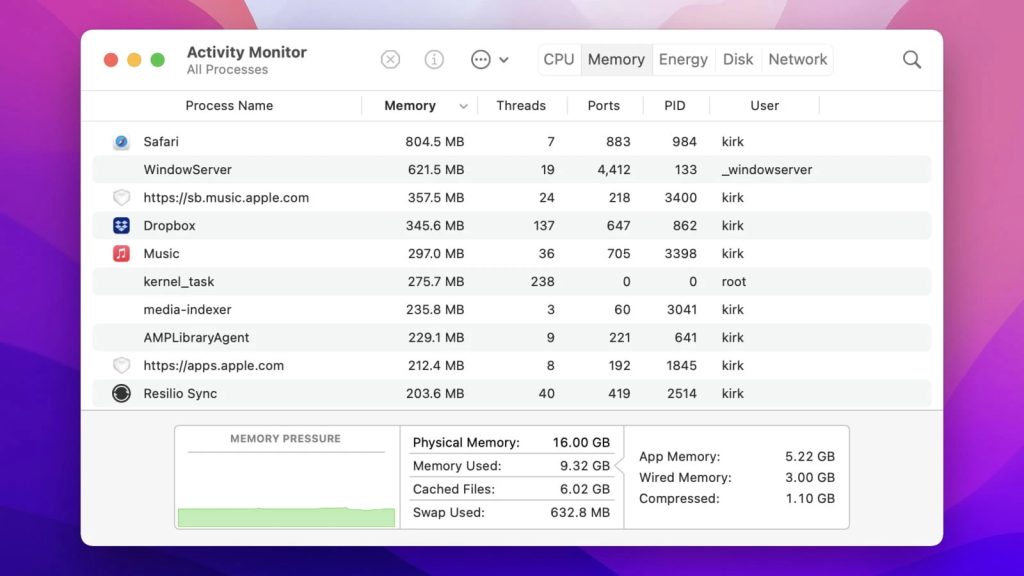
In the Memory pane of the Mac Activity Monitor, you can find out how much RAW your Mac is using, find a real-time memory graph with values. These stats will help you diagnose performance, and check the used memory, wired memory, application memory, etc.
- Memory Pressure. Here you will see the availability of memory resources highlighted in different colors.
- Physical Memory. The amount of your Mac’s RAM.
- Memory Used. The total amount of memory currently used.
- App Memory. The total amount of memory currently used by all applications and their processes.
- Wired Memory. Memory that cannot be paged out.
- Compressed. The amount of memory that is compressed to make room for other processes.
- Swap Used. The total amount of memory used on the startup drive by macOS memory management.
- Cached Files. Memory that was recently used by applications and is now available for use by other applications.
Energy Pane
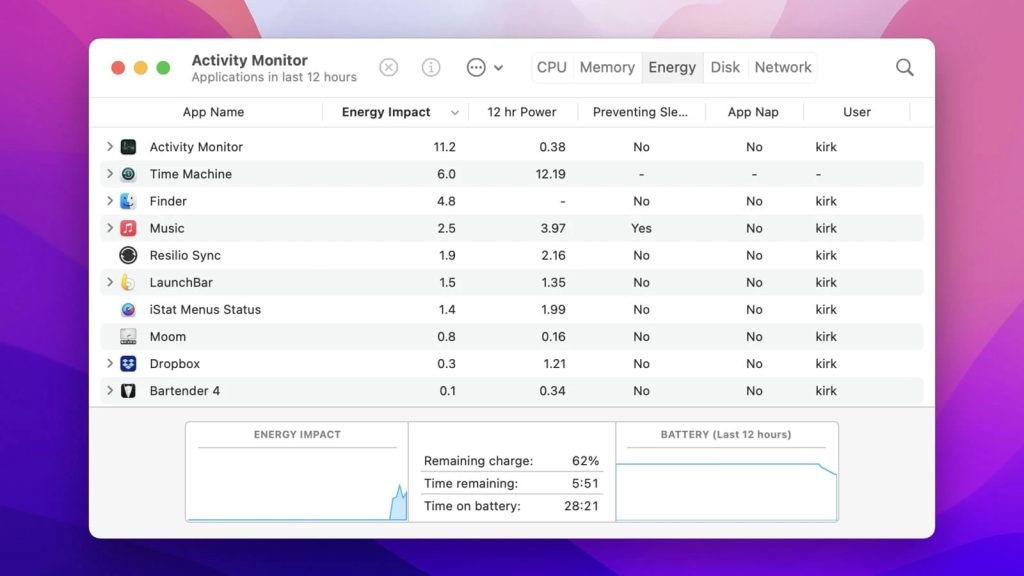
The Energy tab shows the total energy use, as well as provides information on how much energy each app consumes. Let’s check each parameter of the Energy pane.
- Energy Impact. The total energy used by all applications.
- Graphics Card. The type of graphics card being used.
- Remaining Charge. Percentage of remaining battery life.
- Time Until Full. The amount of time the Mac must be plugged into the power source before it is fully charged.
- Time Remaining. Estimated time that a Mac can run on battery power.
- Time on Battery. The time elapsed since the device was unplugged from the power source.
- Battery. Battery level for the last 12 hours.
Disk Pane
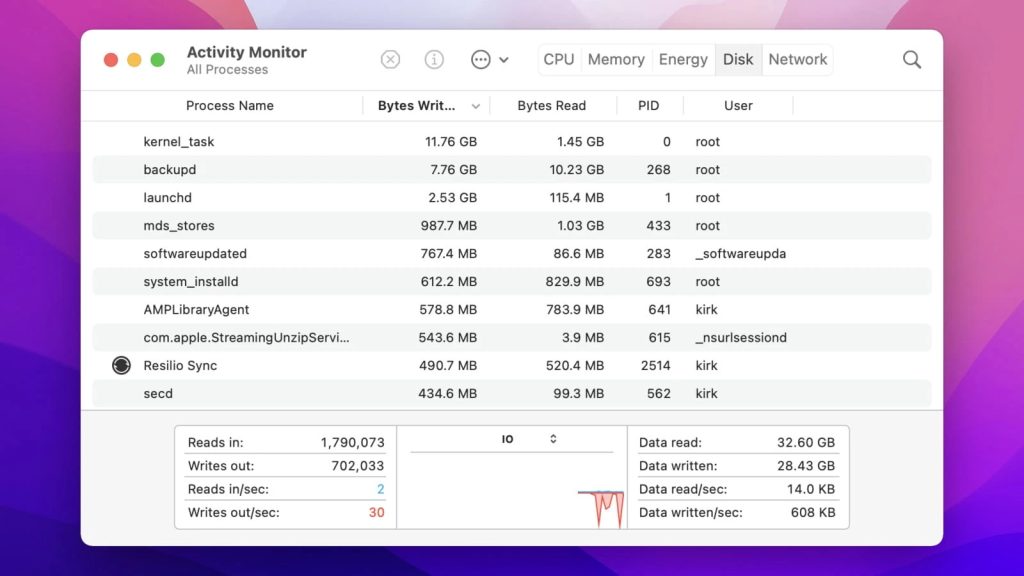
The Disk panel shows the amount of data each process has written to and read from your disk. It represents the number of times your Mac has accessed the disk to read and write data.
Network Pane
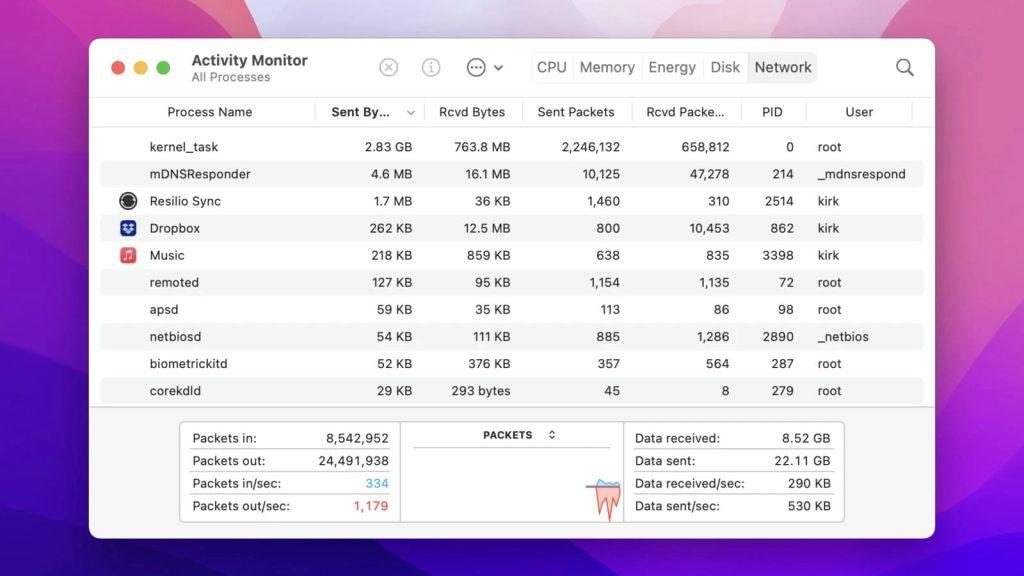
The Network tab displays the data your Mac is sending or receiving over the network. You can also quickly identify the applications that are transferring data and external resources for each process in the Task Manager. The information at the bottom of the Network pane shows the overall network activity of all applications.
Cache Pane
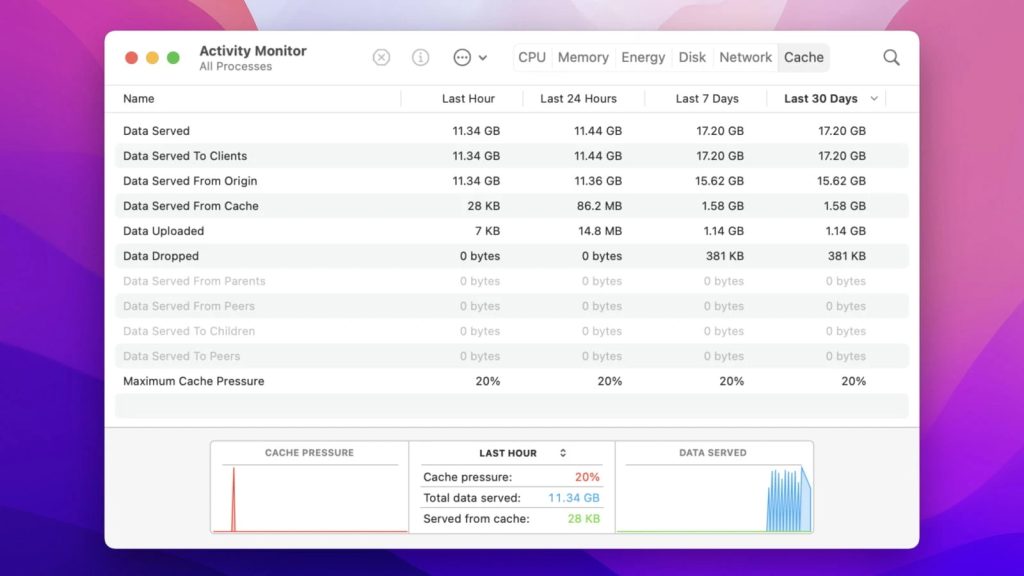
If your MacBook is running macOS High Sierra 10.13.4 or later and the content caching is enabled, you’ll also see an additional pane – Cache. Here you will find information such as the amount of cached content uploaded, downloaded, or dropped over time by local network devices.
Conclusion
It is very important to know how to use the MacBook Task Manager. Activity Manager not only stops slow or unresponsive processes but also contains useful data and statistics to help you check and improve your Mac’s performance.
Frequently Asked Questions
If you want to know what kind of processes are running on your Mac you need to open Activity Monitor.
Press Command + Spacebar to invoke the Spotlight search field. Start typing “Activity Monitor”. Select the Activity Monitor when it comes up.
Press Command + Option + Esc to open the Force Quit dialog.
By default, there is no shortcut to open Task Manager on Mac. However, you can create your own. Go to System Preferences > Keyboard > Keyboard Shortcuts.
